Overview
Timeline plots your records along a timeline. It’s a rebuild of the old timeline, using what came out of Report, and the change in purpose matters: the old one was built for print, this one is built for analysis.
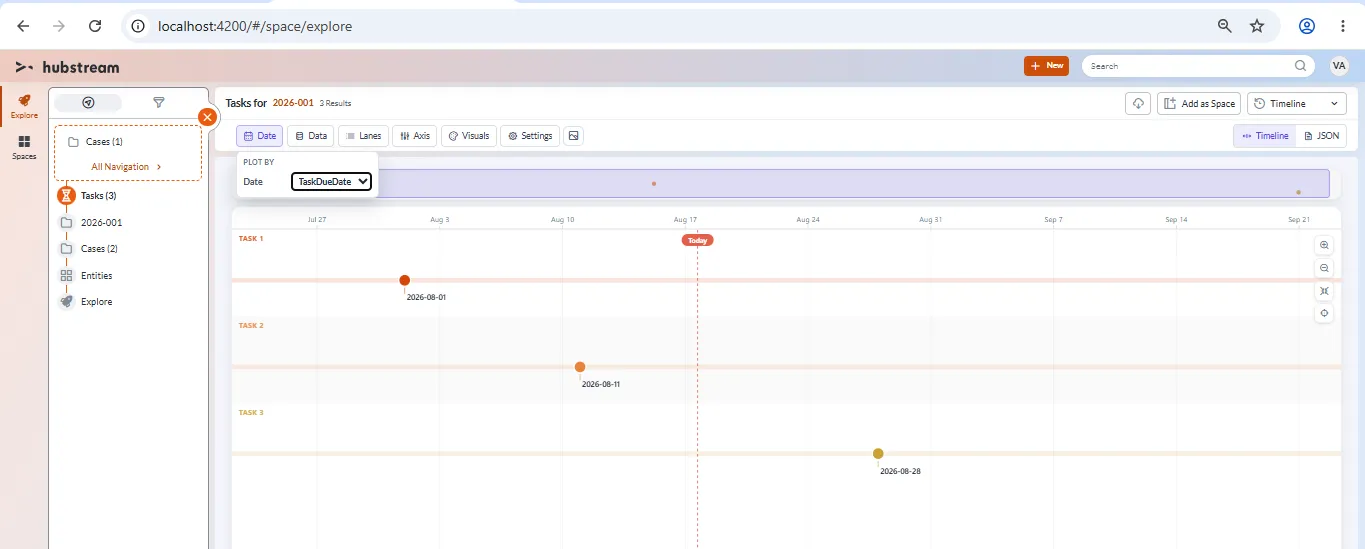
Three tasks in their own lanes, plotted by task due date. The overview map runs along the top, the Today marker is the dashed line, and the toolbar groups every setting into Date, Data, Lanes, Axis, Visuals, and Settings.
Print isn’t here yet. It can come later — plotter printing is a job in itself.
The old timeline hasn’t been removed. Both exist for now, sharing icons and images, and the old one gets retired once this one proves itself.
Choosing what appears
Navigate to a set of records, then switch the view to Timeline.
Any entity type works, because everything in Hubstream has dates — cases, tasks, events, IP addresses, cyber tips, whatever you’re looking at.
Moving around
- Zoom with the buttons or your mouse.
- Fit pulls the whole timeline into view.
- Today focuses the view on now.
Date and Data
Two toolbar groups decide what gets plotted and what each item says.
Date is the field to plot by. A task gives you its creation date or its due date; an event might give you an event date, or just a date. Every entity should offer its own dates here, and the default is usually sensible.
Data is the text. Pick the field for the label — the name, normally — and the field for the details underneath. Any long text field works, and notes are usually the right answer, though you could use status or a due date instead.
Lanes
Lanes split the items into rows, grouped by a field. Group by task type or status and you get a lane for each one.
Group by something unique, like an ID, and you get one lane per record. That’s rarely what you want, but the option follows the data rather than a fixed list, so anything in your data is available.
Axis modes
The axis controls how the space between items is drawn.
| Mode | What it does |
|---|---|
| Linear | Real time. Gaps match the actual time elapsed, the way a timeline normally works. |
| Static | Sequence only. Items are evenly spaced — this happened, then this, then this — with no sense of distance. Items on the same day still read as the same day. |
| Gapped | In between. Not truly linear, but a year-long gap still draws wider than a day-long one. |
| Compressed | A tighter variation on gapped. |
Linear is the one you want when the spacing itself is the point. Static is for when only the order matters.
Clustering
With clustering on, items that sit too close together collapse into a cluster. Click it and the timeline zooms in far enough to separate them, or breaks the cluster into smaller ones if there are a lot.
This is also how you get at items recorded at the exact same time: they cluster, and clicking shows you both.
Visuals and Settings
Visuals carries the color schemes — turbo, plasma, spectral, light fade, warm fade — plus light and dark themes.
Settings holds the rest:
- Vertical or horizontal. Both work properly. Horizontal suits a wide monitor.
- Clustering, as above.
- Today marker, the dashed line marking now.
- Overview map, the strip along the top. On a long timeline it’s the quickest way to move around.
Annotating a timeline
The timeline has the fullest set of annotations anywhere in the product.
Click a node and you get a card telling you what the item is. From there:
- Pin the card and it stays on the timeline permanently. Pinned cards keep their places and sit alongside each other as you zoom out, which is what makes two items at the same moment readable — pin them both and you can see both at once.
- Draw an arrow to an item. Click off it to remove it.
- Add a comment, which is attributed to you.
- Add a note, which stays with the view.
- Change an item’s icon to an emoji, which sticks to that item.
- Add a sticker, which binds to a moment in time rather than to an item. Drop a “case closed” sticker on today and it stays on today however you zoom or pan.
Comments and notes hold their order and keep pointing at their targets even when the timeline is squeezed right down.
Images
If records have images connected, the images appear on their own line beneath the lane’s items, with a short line drawn to connect them. Lane on top, items, then images below that, sitting under the comments and notes.
There’s nothing to set up. Images come from the system, so anything already attached shows up.
Known limitations
- Changes only save locally. Settings and annotations are written to a definition on your machine, not to the server. Where it should live isn’t settled — a config on the space is the likely answer.
- The JSON payload is exposed in the interface. It’s useful for seeing what a setting actually did, and for copying or applying a definition, but it isn’t meant for everyday use.
- Clicking a node shows a generic card. It should show the proper entity tile for the record’s type — an investigation for an investigation, a task for a task — and that isn’t built.
- No print. This version is for analysis. Print may return later.
- Emoji search is unreliable. Searching for an emoji that exists doesn’t always find it.