🧪 Experimental feature (preview). This feature is under active development and released early so you can try it and give feedback. Behaviour, options, and results can change without notice, and it isn’t covered by the usual support and stability guarantees. Avoid relying on it for production work.
Overview
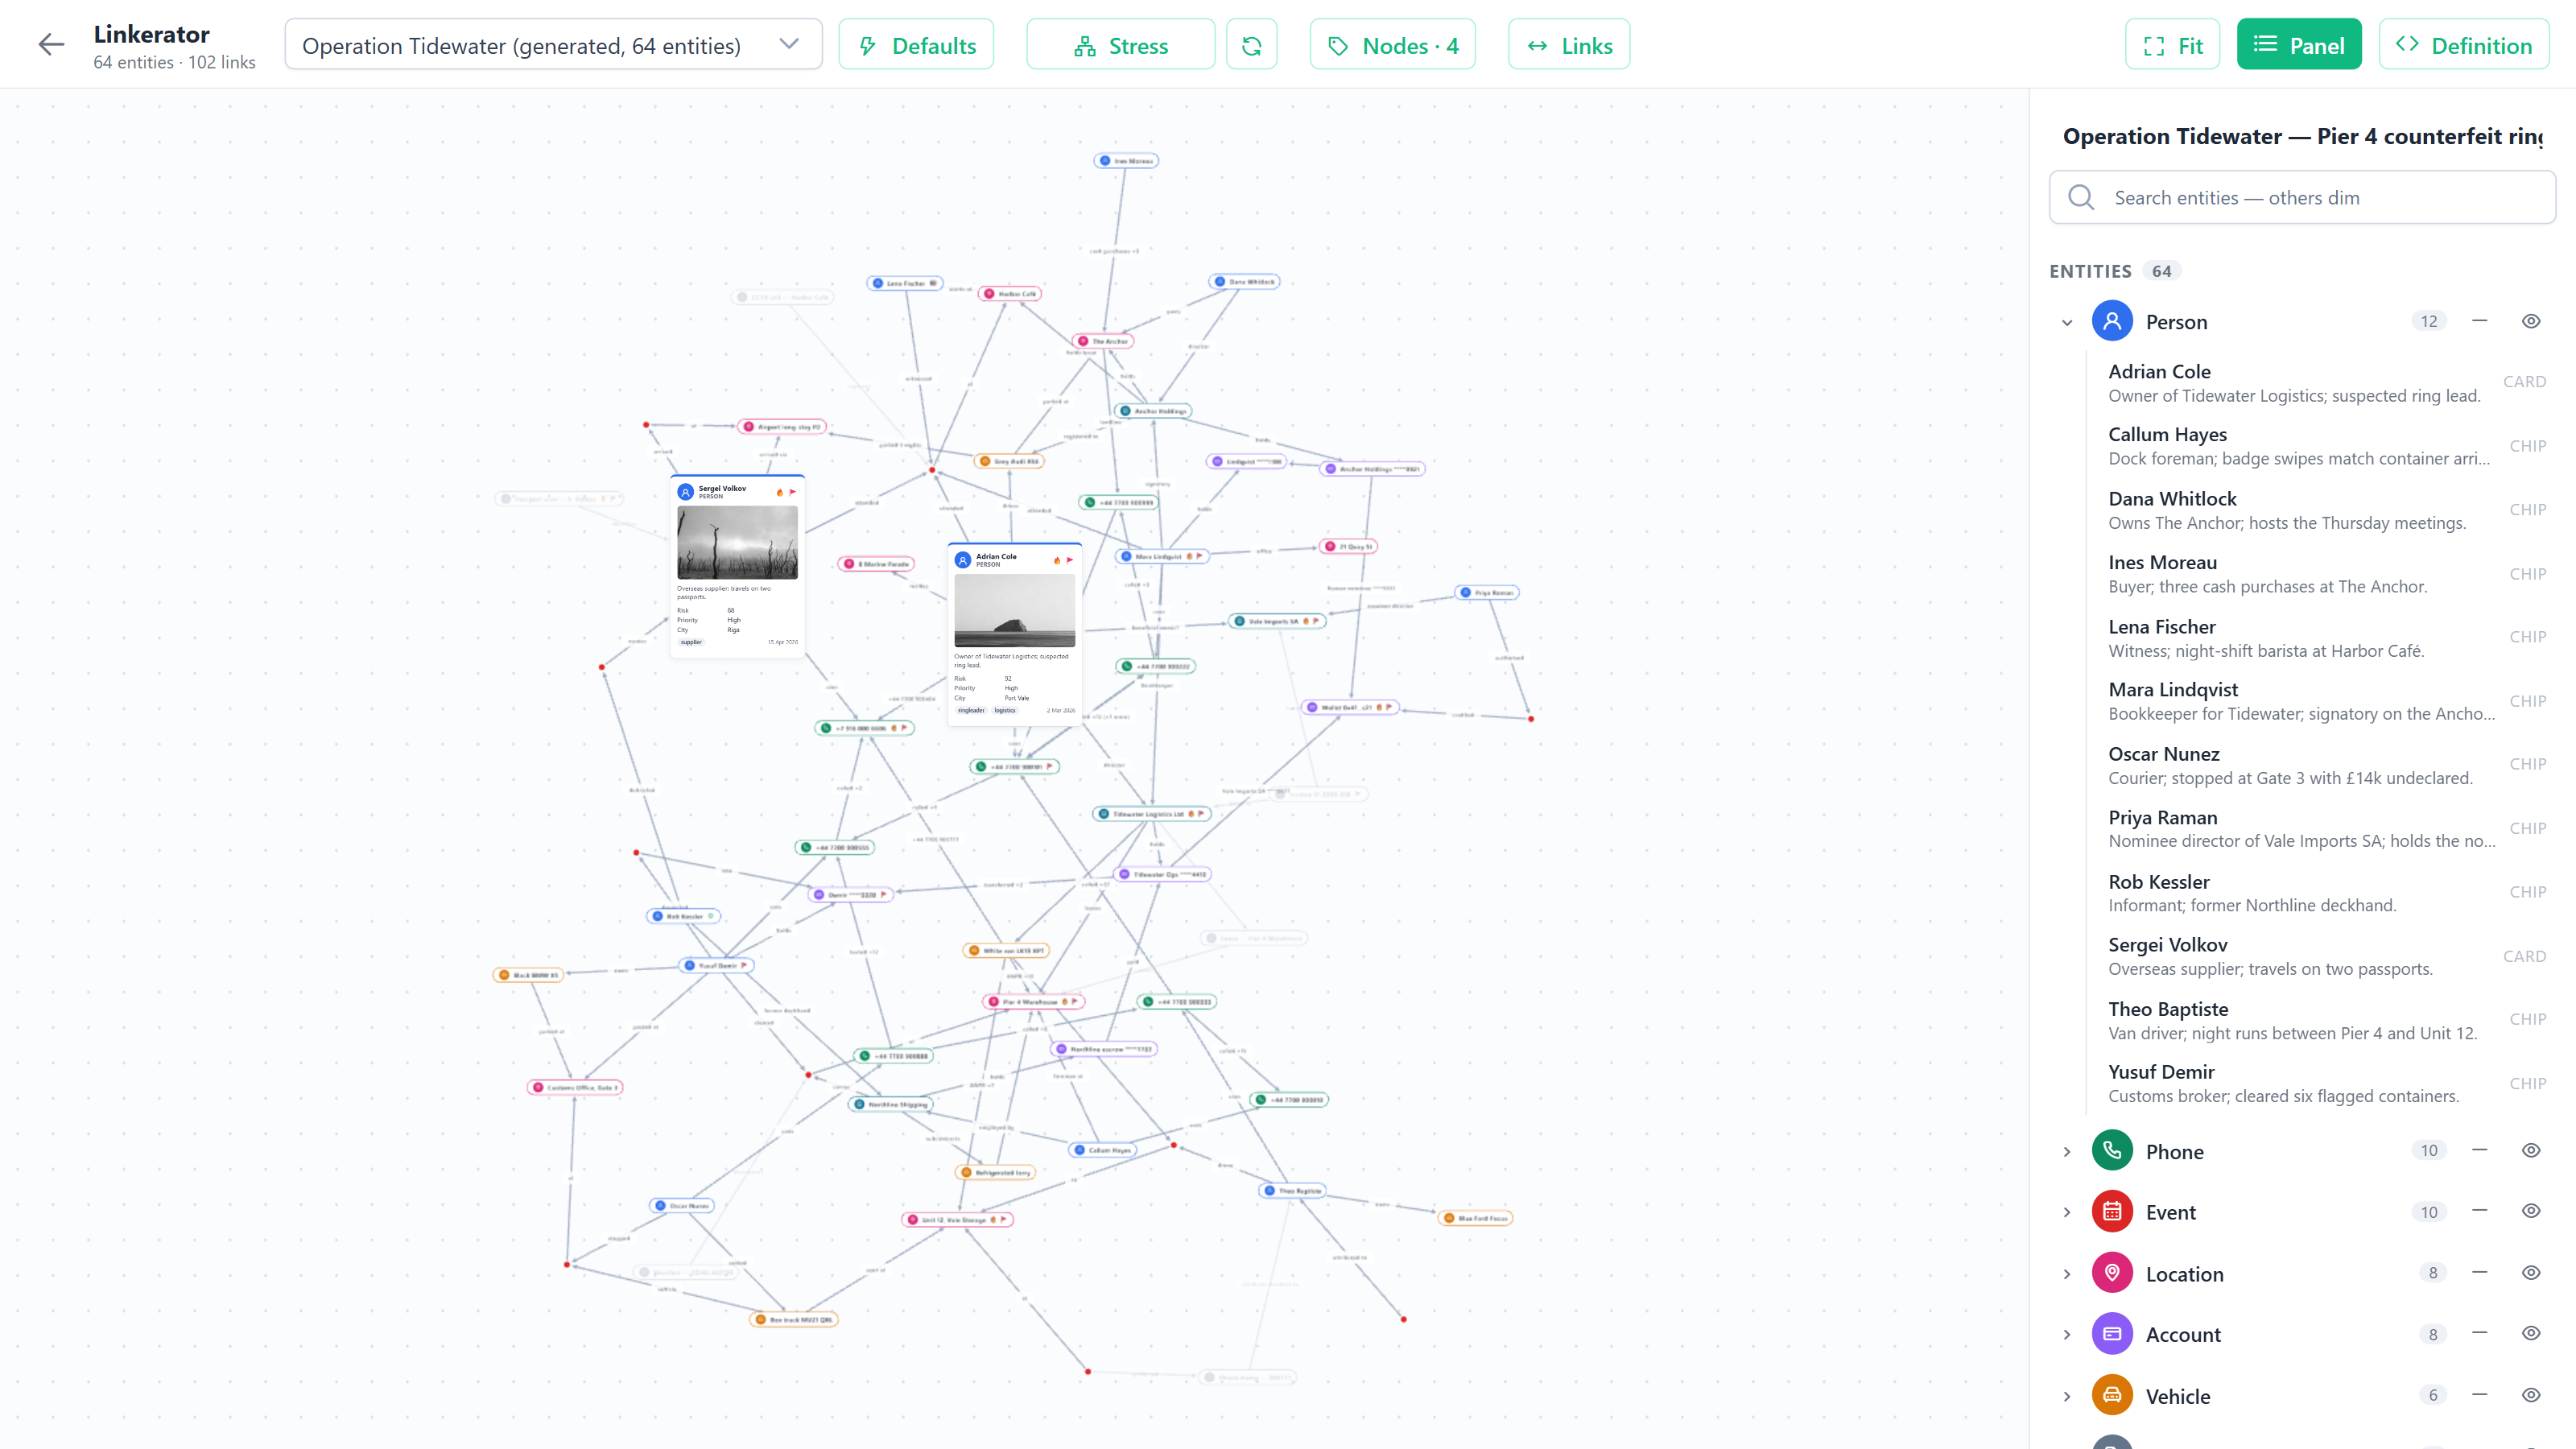
Link Chart draws the records of the current list together with the records they link to - the same network the Graph view reads - as an entity-relationship chart built for investigation. Everything that can be many (lines, arrowheads, labels, dots, chips) is drawn on the GPU, so a chart of thousands of entities stays smooth; the few rich cards are ordinary page elements that pan and zoom with the canvas. Layout runs in the background, so a large network never freezes the page.
Choosing what appears
Open a list of records of one entity type (a case list, say) and switch the view to Link Chart. The chart shows those records and the records linked to them, up to the network depth configured for the Graph view. Each entity type shows the same icon it has everywhere else in the app and gets a colour from the chart’s palette (see Visuals); click a type’s swatch in the panel to pick another.
When the list has nothing linked to draw, the view offers to jump to related case-like records instead, opening them straight in the Link Chart.
Display modes
Every entity is drawn in one of seven modes. A mode can be set for the whole chart (Entities control), for an entity type (the panel’s folder row), or for one entity (its toolbar or the panel):
| Mode | Drawn as |
|---|---|
| Line (collapsed) | Hidden - and what it stood between is re-linked. Two visible entities joined through collapsed ones get one line, labelled with the folded names and/or link labels. Collapse every type but people and you get a person-to-person chart. Expand on the line brings the folded entities back. |
| Hidden | Available but not shown: the entity and its links are left out, and nothing is re-linked through it. |
| Highlight connectors (for a whole type) | A highlighted chip when the entity connects two or more other entities (a phone number linking a person to a company), otherwise hidden. |
| Dot | A small disc in the type colour; name on hover. |
| Chip | A pill with the type icon, the name, and any decor glyphs. |
| Faded chip | A chip at 20 % opacity; its lines fade too. |
| Card | A card with type badge, name, the entity’s fields (the same ones the Grid shows for it) and tags; point at a value to see which field it is. Cards can be dragged. |
Parallel links between the same two entities draw as a single line whose width grows with the number of links; a collapsed line takes the width of its weakest hop.
Defaults
The Defaults control starts with three views built on each entity type’s role - Primary entity (people, companies, online profiles), Event (cases and other business processes, activities), Identifier (email addresses, phone numbers, addresses - what relates actors to each other) or Excluded:
| View | Primary entities | Events | Identifiers |
|---|---|---|---|
| Explore - all entities and the links between them | Chip | Chip | Chip |
| Relationships - which key actors are related | Card | Line | Line |
| Structure - which actors are related, and the identifiers behind it | Chip | Line | Highlight connectors |
Roles are worked out from the entity model (internal and file entities are excluded; business processes and activities are events; identifier-like types such as email, phone or address are identifiers; the rest are primary). When a type’s role is wrong for your model, change it with the Role selector at the top of the type’s folder in the panel - the choice is saved with the chart.
It also holds ready-made investigative views. Communications and Evidence use Highlight connectors too: a phone, email or document only appears (highlighted) when it links two or more entities. The views: People, Case map, Companies, People & companies, Communications, Money flow, Places, Evidence, Full detail and All dots. They are written in roles (case, person, organisation, phone / email, account, location, event, evidence, vehicle) that resolve against your own entity types - by entity template where it is unambiguous (case-like, person-like, activity and file entities) and by entity name otherwise. A view whose key role has no entity type here stays listed but disabled, saying what it needs. Applying one resets display modes, hidden types and pinned positions, then re-lays out.
Layout
The Layout control holds every layout knob: the algorithm (Layered, Stress, Force, Tree, Radial, Box, Rect packing, Overlap removal, Random), direction for the directional ones, and spacing. Plot X / Y places entities by value instead. Across, each entity type shown on the chart plots its own field (a case’s Date Received, a person’s Date of Birth) - they start on dates that share a timeframe, and you can change any of them; Down is one field for all, entity type by default. Dates make a time axis and numbers a scale. Entities never overlap: a crowded row spreads into extra lanes, and entities without a value wait in a strip below the plot.
Positions only change when the chart first loads, when you press Re-layout, or when you change something in the Layout control. Changing modes, decor or links never moves anything. Drag an entity to pin it where you want it; re-layouts leave pinned entities alone, and the pin count in the action bar unpins them all at once.
Links
The Links control turns arrowheads (always pointing the way the data does) on or off and sets the Labels: Off, Link labels, Entity names or Both. A direct link always reads its own label; a line standing in for collapsed entities can name those entities, their links, or both. Select a line to change its own arrow and label, pin its full label as a draggable tile beside the line, or hide it; hidden links come back from the Links control.
Visuals
The Visuals control holds the same two choices as the other views:
- Background - Light, Dark, Light fade, Warm fade or Dark fade. Chips, cards, labels and toolbars follow it.
- Entity colours - a palette (Tableau by default, or Ember, Slate, Earthen and the colour ramps), given to the entity types in the order the chart shows them, so no two types share a colour until the palette runs out. Entity colours uses each entity’s own colour from its settings instead.
Every colour is kept readable on the background: one too pale for a light background (a light gold, say) is drawn in a deeper shade of the same hue, and one too dark for a dark background in a lighter one. Picking a palette replaces colours chosen by hand in the panel.
Decor rules
Under Entities, a decor rule badges the chips and cards of one entity type whose field matches - for example Person · Approximate Age > 40 → 🔥. Pick the type first; the field list then shows that type’s fields. Rules compare numbers, dates or text (=, ≠, >, <, contains, has value) and show an emoji or an icon in a colour you choose. Individual entities can also carry hand-picked glyphs from the panel.
Working the chart
- Click an entity or a line to inspect it in the panel: its fields, its links (click one to jump to the other end), display mode and decor.
- Highlight any single entity with the sun button on its toolbar or in the panel: it keeps its shape (dot, chip or card) and gets a bright amber glow. Click again to remove it.
- Search in the panel dims everything that doesn’t match.
- Open a record from a card’s title, the entity toolbar’s arrow, or the arrow in the panel.
- Select records with the check on a card, the toolbar, or the panel (or Ctrl+click an entity). The page’s selection bar and context actions work on chart selections, and Select All selects every entity the chart draws. Esc clears.
Annotations
The Annotate control adds marks of your own on top of the chart: a header, a note (in a choice of colours), an emoji, an icon, or a Hubstream sticker. New marks land in the middle of the view at a readable size, then pan and zoom with the chart. Drag one to move it; click it to edit its text, resize it, recolour it or delete it. Annotations are saved with the chart. (See Annotations for how marks work across views.)
Saving
The chart keeps your changes as you work - dragging an entity, changing a mode, a colour, the layout or an annotation - with no save button. Each list keeps its own chart: it is filed under the list’s entity type and its first and last record, so coming back to the same cases while you’re still on the page brings back the same chart, while a different list starts its own. Nothing is saved on your computer: the chart lives with the page while you’re on it, and a list you haven’t opened before (or one you open again after leaving the page) starts from the defaults.
To keep a chart, use Add as space. The chart is saved with the space, and opening the space’s page brings it back.
The definition
Display modes, type colours and roles, visuals, layout, link options, decor rules, annotations and pinned positions round-trip through one JSON definition, shown in the JSON view. Entities are referenced by id; data is never embedded. Copy it to keep or share a chart; paste one and Apply to restore it.
Configuration
| Setting | Default | What it does |
|---|---|---|
MaxResultCount (the view’s library row) | 1000 | The most records of the list the network is built around. Beyond it, the chart covers the first N and a banner says so. |
Known limitations
- Only spaces keep a chart. Outside a space, a chart lasts only while you’re on the page; add the page as a space to keep it. Changes you make to a chart inside an existing space last for that visit only - the space keeps the chart it was created with.
- Single-entity lists only, like the Graph view: a query across several entity types doesn’t offer the Link Chart.