Overview
Calendar puts your records on a calendar. It behaves like the calendar in any cloud application — Outlook, Gmail, take your pick — so there’s very little to learn.
You pick it like any other view. Navigate to a set of records first, the same as you would for Chronos View, and switch to Calendar.
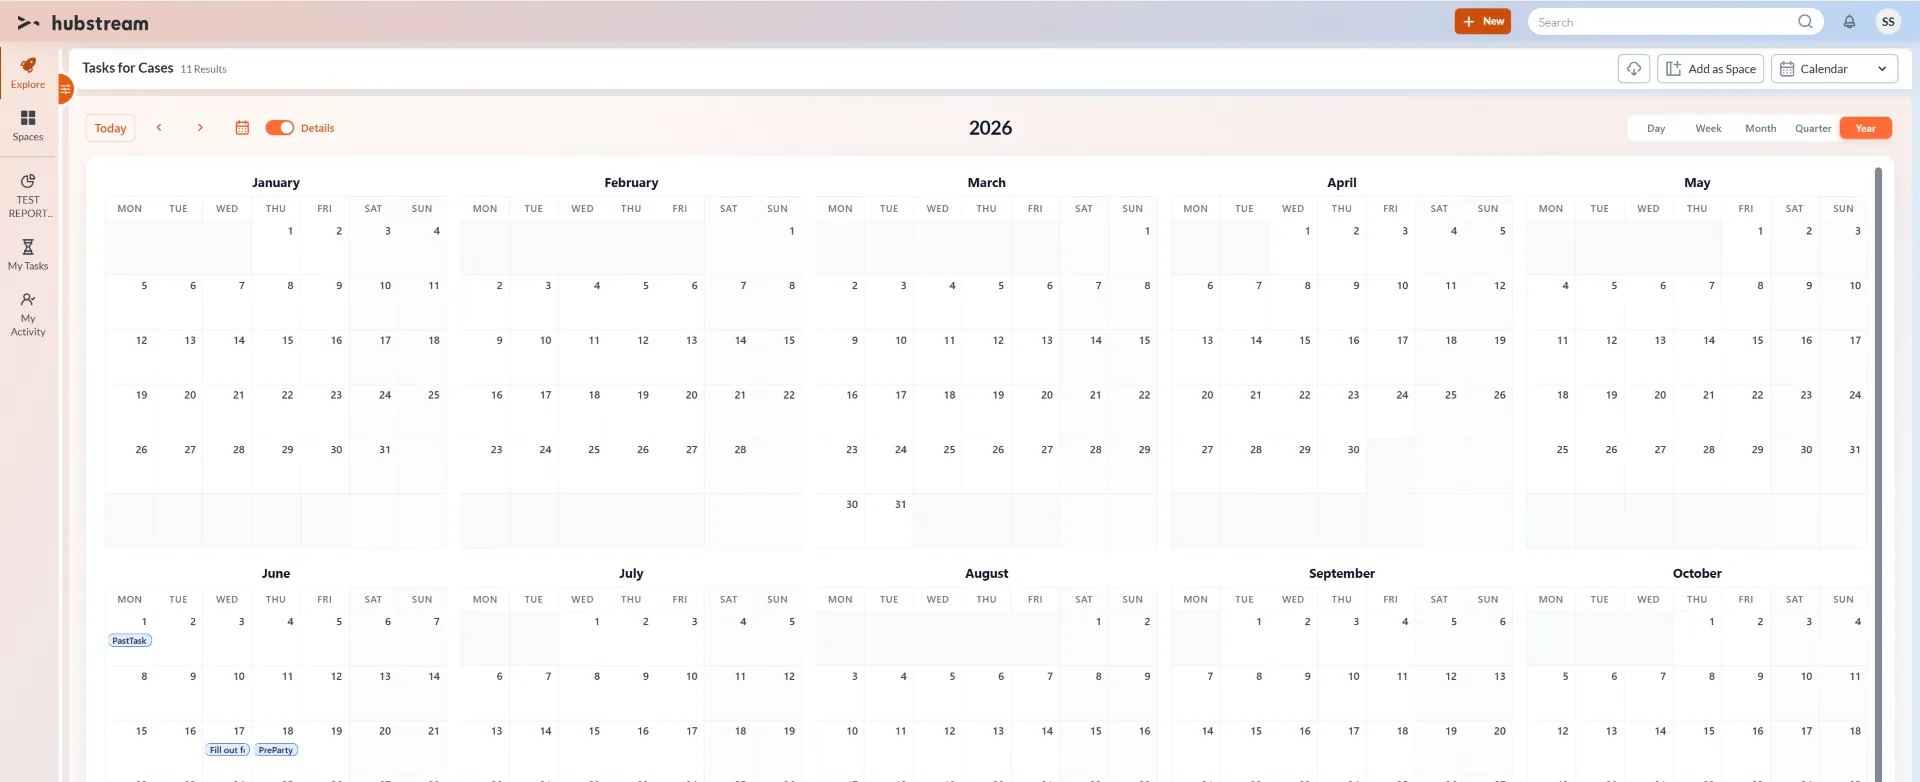
The year view with Details on, so the tasks themselves show on their dates. The switcher on the right moves between day, week, month, quarter, and year.
Don’t confuse this with the calendar primitive available inside a report — that’s a heat map you drop into a report. This is a full view.
Moving around
Most of this is standard calendar behavior:
- Today jumps back to the current date.
- Back and forward cycle through whatever period you’re looking at.
- The switcher on the right focuses the view on a year, quarter, month, week, or day.
- Months and days are clickable. Click a month in the year view to open it, click a day to open that day, and go back to the year when you’re done.
- Click an item to open it. A court date on the calendar takes you to the court date.
Choosing the dates
This is where Calendar differs from an ordinary calendar. Hubstream records carry lots of dates, so you choose which ones the calendar reads.
Calendar looks at the type of record you have open and offers you its date fields. Tasks give you task dates, cases give you case dates.
- One date places each record on a single day — a due date with no end.
- Two dates make a range, drawn as a bar across the days it spans. Task creation date to due date, for example, or a case’s created date through to its completed date. An event’s start and end work exactly the same way, because a range is a range.
Not every combination is useful. If a case’s created date and its created-by date are the same day, a range between them tells you nothing. Choosing the two dates that actually bracket the work is the whole skill here.
Details and the heat map
The Details toggle switches between two ways of drawing the same data.
Off, you get a heat map. Busy periods are shaded more heavily. This is the default at the year view, and it’s what makes a large data set readable.
On, you get the records themselves, drawn as items on their dates.
Which one you want depends entirely on volume. A calendar cell can only hold so many items before it gives up and shows “+2 more” — and with a lot of records that becomes “+10,000 more”, which tells you nothing. That’s the case for the heat map. The reverse is also true: a heat map of five events isn’t worth looking at. Use details when you have few records, the heat map when you have many.
Known limitations
- Your date choice doesn’t save. Pick the fields again next time. Like the other views, anything you change is held locally rather than on the server.
- Hovering an item doesn’t show its tile yet. It should show the right one for the record — an investigation for an investigation, a task for a task — and that isn’t built.
- There’s no action bar. It’s hidden, because there are no calendar actions yet. Adding something straight to a date is the obvious next step.
- Records with no time land as all-day items. If your dates carry no timestamp, the day view shows everything as all-day.