🧪 Experimental feature (preview). This feature is under active development and released early so you can try it and give feedback. Behaviour, options, and results can change without notice, and it isn’t covered by the usual support and stability guarantees. Avoid relying on it for production work.
Overview
Pivot Table turns the list you are looking at into a cross-tab: how many records of each kind, broken down by any two (or more) fields at once, with subtotals, percentages and heat shading. It answers questions like “how many active cases of each priority?” or “which regions grew year on year?” without exporting to a spreadsheet. From any number you can see the records behind it, and open them as a list of their own.
Opening it
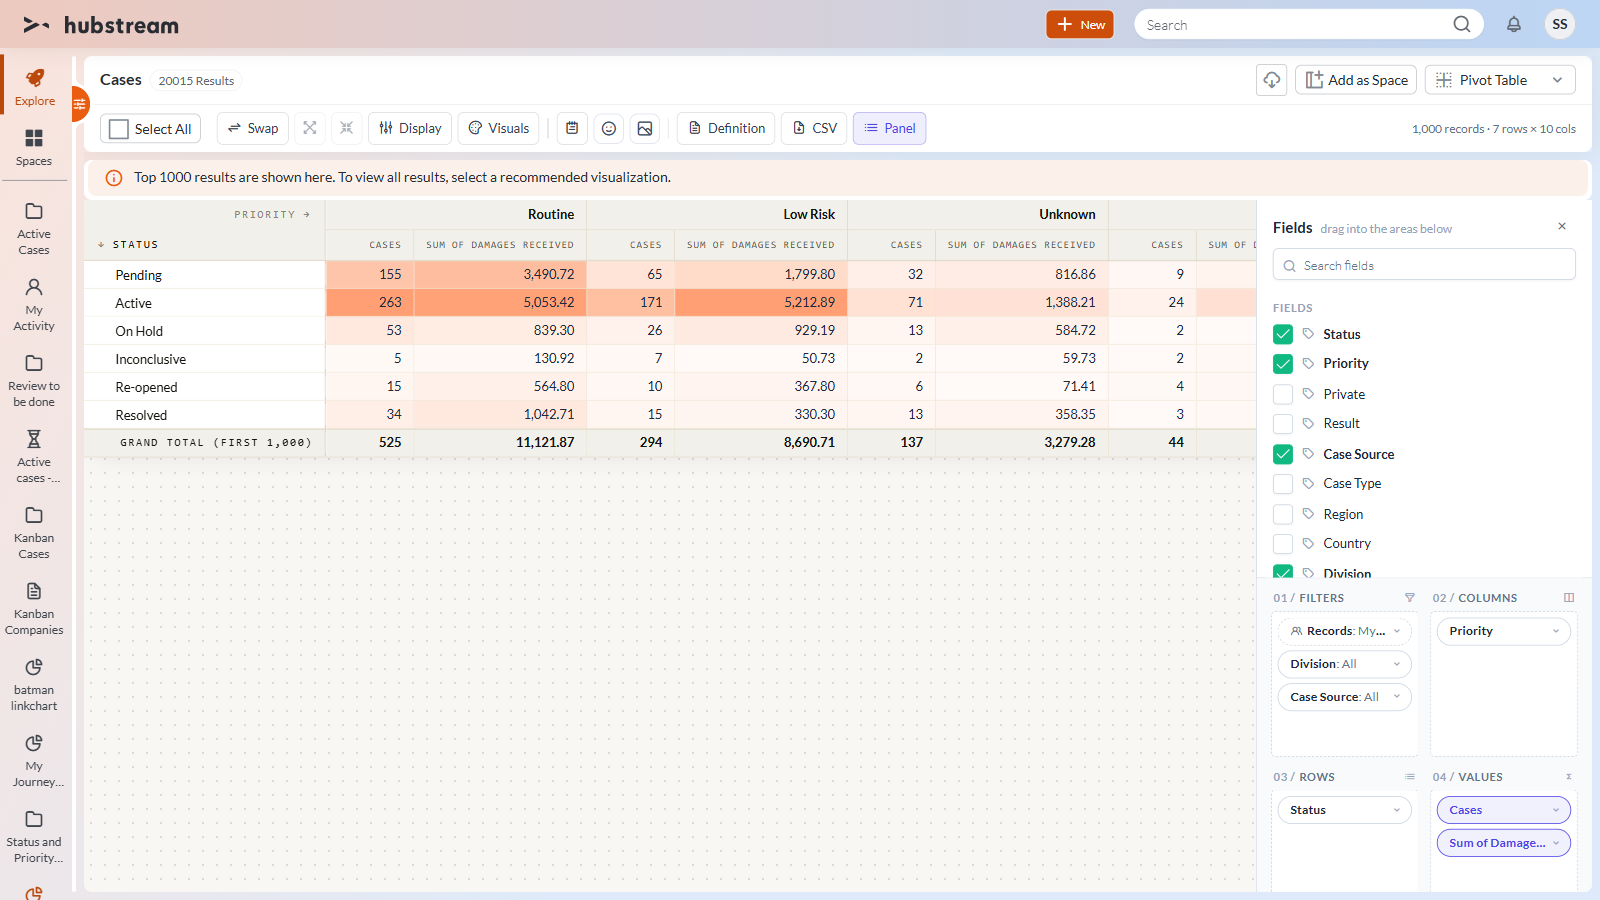
Open a list of records of one entity type (a case list, say) and choose Pivot Table in the view switcher. The first time, the view builds a sensible pivot for you from the list’s own fields: its main category field (such as Status) down the side, a short category (such as Priority) or the year across the top, a count of records in the cells, and the next two categories ready in Filters.
Building a pivot
The Fields panel on the right lists the list’s fields by their names as you know them, in three groups:
| Group | What’s in it |
|---|---|
| Fields | Category fields: pick-lists (in their usual order), Yes/No fields, and short text fields with few values. |
| Dates | Every date field, broken into Year, Quarter, Month, Month of year and Weekday. |
| Measures | Number fields, plus a count of the records themselves (named after the entity, such as Cases). |
Drag a field into one of the four areas, or tick it (a category goes to Rows, a number to Values):
- Rows and Columns - the categories to break the numbers down by. Several fields nest: Status, then Year inside each status.
- Values - what each cell shows. Click the chip to choose Count, Distinct count, Sum, Average, Min or Max, and to show it as a value or as a % of the grand total, row, column or parent row.
- Filters - fields you want to filter by without breaking the table down by them.
Click any chip to sort it, filter its values, move it to another area or remove it. Click a column heading in the table to sort the rows by that column’s numbers (click again to reverse, a third time to clear). Use the arrows next to a group to collapse or expand it.
Which records
The first chip in Filters, Records, says which records the list includes: All records I can see, or My team’s records. It is the same switch as the filter pane’s Filter by team, shown here so the scope of every number is visible.
Large lists
The pivot adds up the records the list fetches, up to the view’s limit (1,000 by default). When the list holds more, the page shows the usual Top 1000 results notice and the grand total reads Grand total (first 1,000). Narrow the list with filters for exact totals. Opening a cell as a list (below) always uses the whole list, not just the first 1,000.
From a number to the records behind it
Click any number to open a preview of the records it counts: the conditions it stands for, the count, and the records themselves with the fields the pivot uses.
- Click a record’s name to open it.
- Tick records to select them; the page’s selection actions (assign, add to space, and so on) work on them, and Select All in the header selects every record the pivot currently covers.
- Open (n) takes you a step further in your journey: a new step named after the cell (for example Cases: Active · Routine) opens in the Pivot Table with the cell’s conditions added to the list’s filters - a year, quarter or month becomes a date range, an empty value becomes “is empty”. The conditions are ordinary filters you can change in the filter pane, and the journey panel takes you back.
Marking a cell
Right-click a number (or use Mark cell in its preview) to highlight the cell in a colour and/or put an emoji in front of the number - a 🔥 on the hot spot, a ❓ on a number to check. A mark stays on its cell when you sort, filter, collapse or swap rows and columns, and it is saved with the pivot.
The action bar
| Action | Does |
|---|---|
| Swap | Swaps rows and columns. |
| Expand / collapse all | Opens or closes every group. |
| Display | Subtotals at the top, bottom or off; grand total row and column on or off; cells plain, as a heatmap or as data bars. |
| Visuals | the background (Hubstream - warm dotted paper with tan bands - by default, or light, dark or a soft fade), the cell colours used by the heatmap and data bars (Hubstream orange or a colour scale such as Viridis or Plasma), and the row density (compact, comfortable, spacious). Numbers stay readable on any cell colour. |
| Note, emoji, sticker | Adds an annotation you can drag anywhere over the table. |
| Definition | The whole pivot as JSON - copy it, edit it, or paste one in and apply it. |
| CSV | Downloads the pivot exactly as shown. |
| Reset | Forgets your changes and rebuilds the default pivot from the list. |
| Panel | Shows or hides the field panel (the panel’s own ✕ hides it too) - handy for presenting the table. |
Saving
Your pivot (fields, filters, display options, visuals and annotations) is kept while you work on the page and switch between views. Use Add as Space to keep it for good: the space reopens with your pivot.
Good to know
- Multi-select pick-list fields aren’t offered: one record would land in several cells and the totals would stop adding up.
- Month of year and weekday can’t be list filters, so a cell that uses them opens its records by their IDs instead.
- Currency amounts are shown as plain numbers, because a list can mix currencies.