Overview
Report turns a set of records into a report you can design, annotate, and export. You pick it like any other view.
It’s the largest of three pieces that arrive together: this view, the Chart Tile, and the chart primitives that both of them draw.
Report was called reporterator while it was being built.
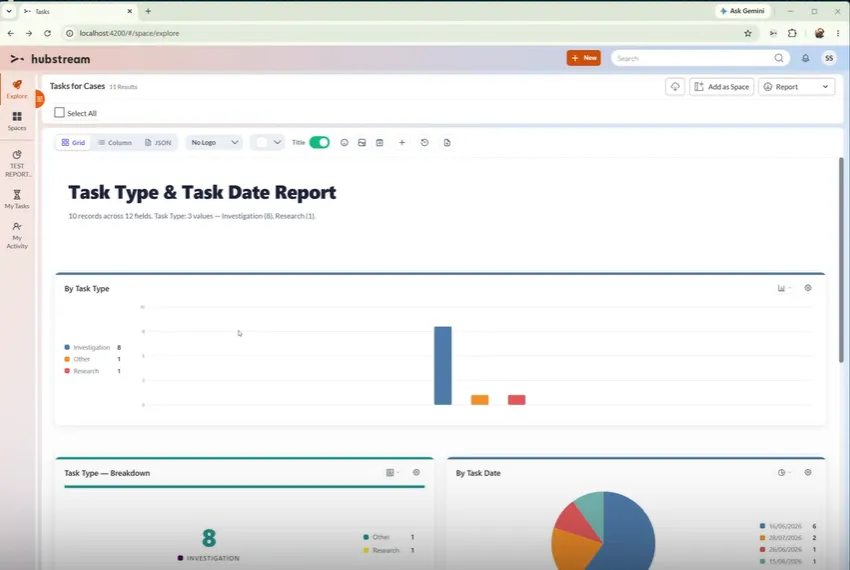
The title and the line under it are generated from the data. The toolbar switches between grid, column, and JSON views, and holds the annotation, reset, and PDF controls.
Choosing what appears
Report works across many records. One record doesn’t give it enough to draw, so navigate to a set first — a group of cases, or the tasks under a case — then switch to Report.
What it draws for you
Report auto-draws what it can from the data it sees. It reads the shape of the data, follows a simple model-based pattern, and writes charts out. No LLM is involved.
By default you get the shape of a report rather than a finished analysis. That’s the point: it’s a report designer, and you adjust from there.
Working on the report
- Layout. Grid or column. The grid fits more in, and that’s where the small, medium, and large chart sizes start to earn their keep. A JSON view shows the definition behind it all.
- Add charts and tiles. The + button opens a picker that tells you what each option is before you add it. Keep adding as many as you need — there’s no reordering yet.
- Settings open beside a chart, in a pop-up, rather than on the back of it. Small charts had nowhere to put them.
- Reset clears the report, including the JSON definition below.
- Annotate. Add emoji, stickers, and notes to say why something matters. They’re saved with the report, so they come back with it and export with the PDF — see Annotations.
Tables
Table (under Content in the picker) puts every record in the report in a scrolling table, rather than the short list the List tile shows. Search it, click a heading to sort (click again to reverse, a third time to return to the list’s own order — the sort is saved), pick columns with the column button, and tick rows to select those records for the actions in the action bar (the same selection as the Grid). The first column opens the record. Rows can be compact, normal or comfy, and striped.
Hubstream tiles in a report
Reports aren’t limited to charts. Some of the simpler Hubstream tiles can go straight in: a single rolled-up number, a model summary, Street View, Countdown, and Marquee.
These are the real tiles, not copies of them. A countdown in a report is the countdown tile, so it works the way it does anywhere else — pick a date field, choose countdown or elapsed, and it counts. Six days overdue reads the same here.
Each tile in a report carries two controls: a button naming what the tile is, which you click to swap it for something else through the same picker, and the edit button that opens that tile’s own settings.
KPI with trend and the Big Button
KPI with trend (under Single value) shows one big number with a small trend line over a date property and the change over the last 30 days against the 30 before - or says “no prior period” when there’s nothing to compare with. Big Button (under Hubstream Tiles) runs a real action - edit, assign, refer, set a field, add or link a record - on the records ticked in a Table tile; with nothing ticked it stays greyed out and says how to select.
Maps
Map (under Content) shows the records on an Azure map, clustered where they’re close together - placed by their own latitude and longitude, or by looking up their address properties. Click a marker to open the record. It says how many records it could place, and if maps aren’t set up for the site it says that instead.
The JSON definition
Every change you make is written into a JSON definition. You can also paste a definition in to force a specific design, which is the quickest way to reproduce a report exactly. The format is documented in Writing Report Definitions, with a per-chart reference and a design guide for drafting one from a column profile — by hand or with a model.
The definition is saved locally, not to the server. Save the report as a Space and it comes back later with all your changes.
Exporting to PDF
Save to PDF exports whatever you’ve built. Report generates a title and a best-effort description for you. The description is a rich text editor, so you can highlight the parts that matter. You can swap the logo or remove it, and turn the title off.
Known limitations
- Nothing saves to the server yet. The definition lives locally, so save the report as a Space if you want it back.
- Charts can’t be reordered.
- There’s no loading state. A large report can look like it’s hanging while it draws.
- Your data has to suit the chart. See Chart primitives for what that means in practice.
- The JSON definition is exposed in the interface, and shouldn’t be. It’s there for developers, not for everyday use. It needs to move — to the space, or to an entity of its own.