Overview
Chart primitives are the charts themselves. One library, drawn by the Report view, the Chart Tile, and the Summary tile alike.
Every primitive follows the same rules for palette, light and dark themes, legend placement, and size. So a chart looks the same wherever you put it, and moving one between a tile and a report doesn’t change how it reads.
What’s available
The library is large. Here’s the set at a glance:
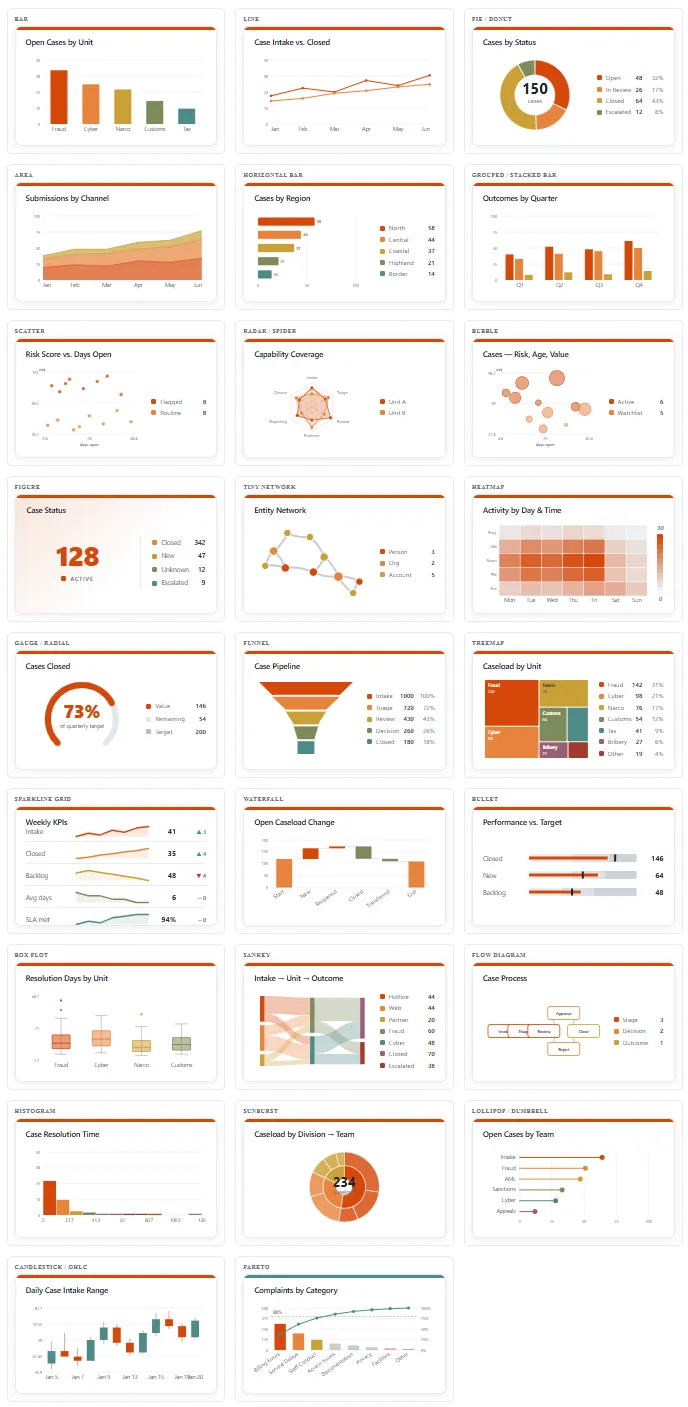
Every primitive drawn with sample data. The three newest — calendar heat map, gantt, and the grouped list — aren’t on this sheet yet.
Grouped by what you’d reach for them to do:
| Purpose | Charts |
|---|---|
| Compare values | bar, horizontal bar, grouped and stacked bar, lollipop and dumbbell, bullet, pareto |
| Show change over time | line, area, sparkline grid, waterfall, candlestick and OHLC, calendar heat map, gantt |
| Break down a whole | pie and donut, treemap, sunburst, funnel, sankey |
| Show a distribution | histogram, box plot, heatmap |
| Show a relationship | scatter, bubble, radar and spider, tiny network, flow diagram |
| Show one number | figure, gauge and radial |
| List the records themselves | grouped list |
The grouped list
The grouped list is the odd one out: it shows you the records, not a summary of them.
- Rows are clickable. Click one and you go to that record.
- You pick the columns. Choose which fields appear in a row — name, type, notes, assigned to, even the GUID — and add as many as you need. Set the colors yourself; it all works in dark mode.
- Group by a field to split the list into sections. Grouping tasks by status gives you a completed section and a not-started section.
- Auto-grow instead of a scroll bar. Turn it on and the list grows to fit what’s in it.
- It follows the color palettes, which starts to matter once a report holds more than one list.
The calendar
The calendar primitive is a heat map over dates. Pick the date field it should read — without one it has nothing to place. Like any heat map, it wants enough records to be worth looking at. For a full calendar rather than a chart, see Calendar View.
Filter and group by
Two controls work across the primitives:
- Filter narrows what a chart draws from: greater than, less than, is empty, contains, and so on. It’s deliberately simple for now.
- Group by collects the data into groups. In most primitives that’s how a chart gets its series. In the grouped list it splits the list into labeled sections instead.
Your data has to suit the chart
This is what decides whether a chart is any good, and it’s worth reading before you pick one.
Hubstream handles basic, one-level math well. Anything deeper needs calculated fields. Most of these charts want numbers, and a count of things won’t always give them enough to work with — a sankey or a box plot has nothing to draw from a tally.
So if a chart looks wrong, check the shape of the data before you change the chart. Usually the fix is a calculated field, not a different primitive.
Describing the library to a model
The library ships with a markdown description of every chart and what it can do. That’s there so a model can choose or design charts against the library, rather than guessing at what exists. For the Report view specifically, see the Report Chart Reference (what each chart reads and needs) and Designing a Report from Data (how to pick charts from a column profile).