Overview
Most views answer what do I have? Flowchart View answers where is it? It draws the workflow a record type moves through — the stages, and the transitions between them — and then places the records from your current query onto it. A case that’s on hold sits on the On Hold stage. Three cases on hold sit there together.
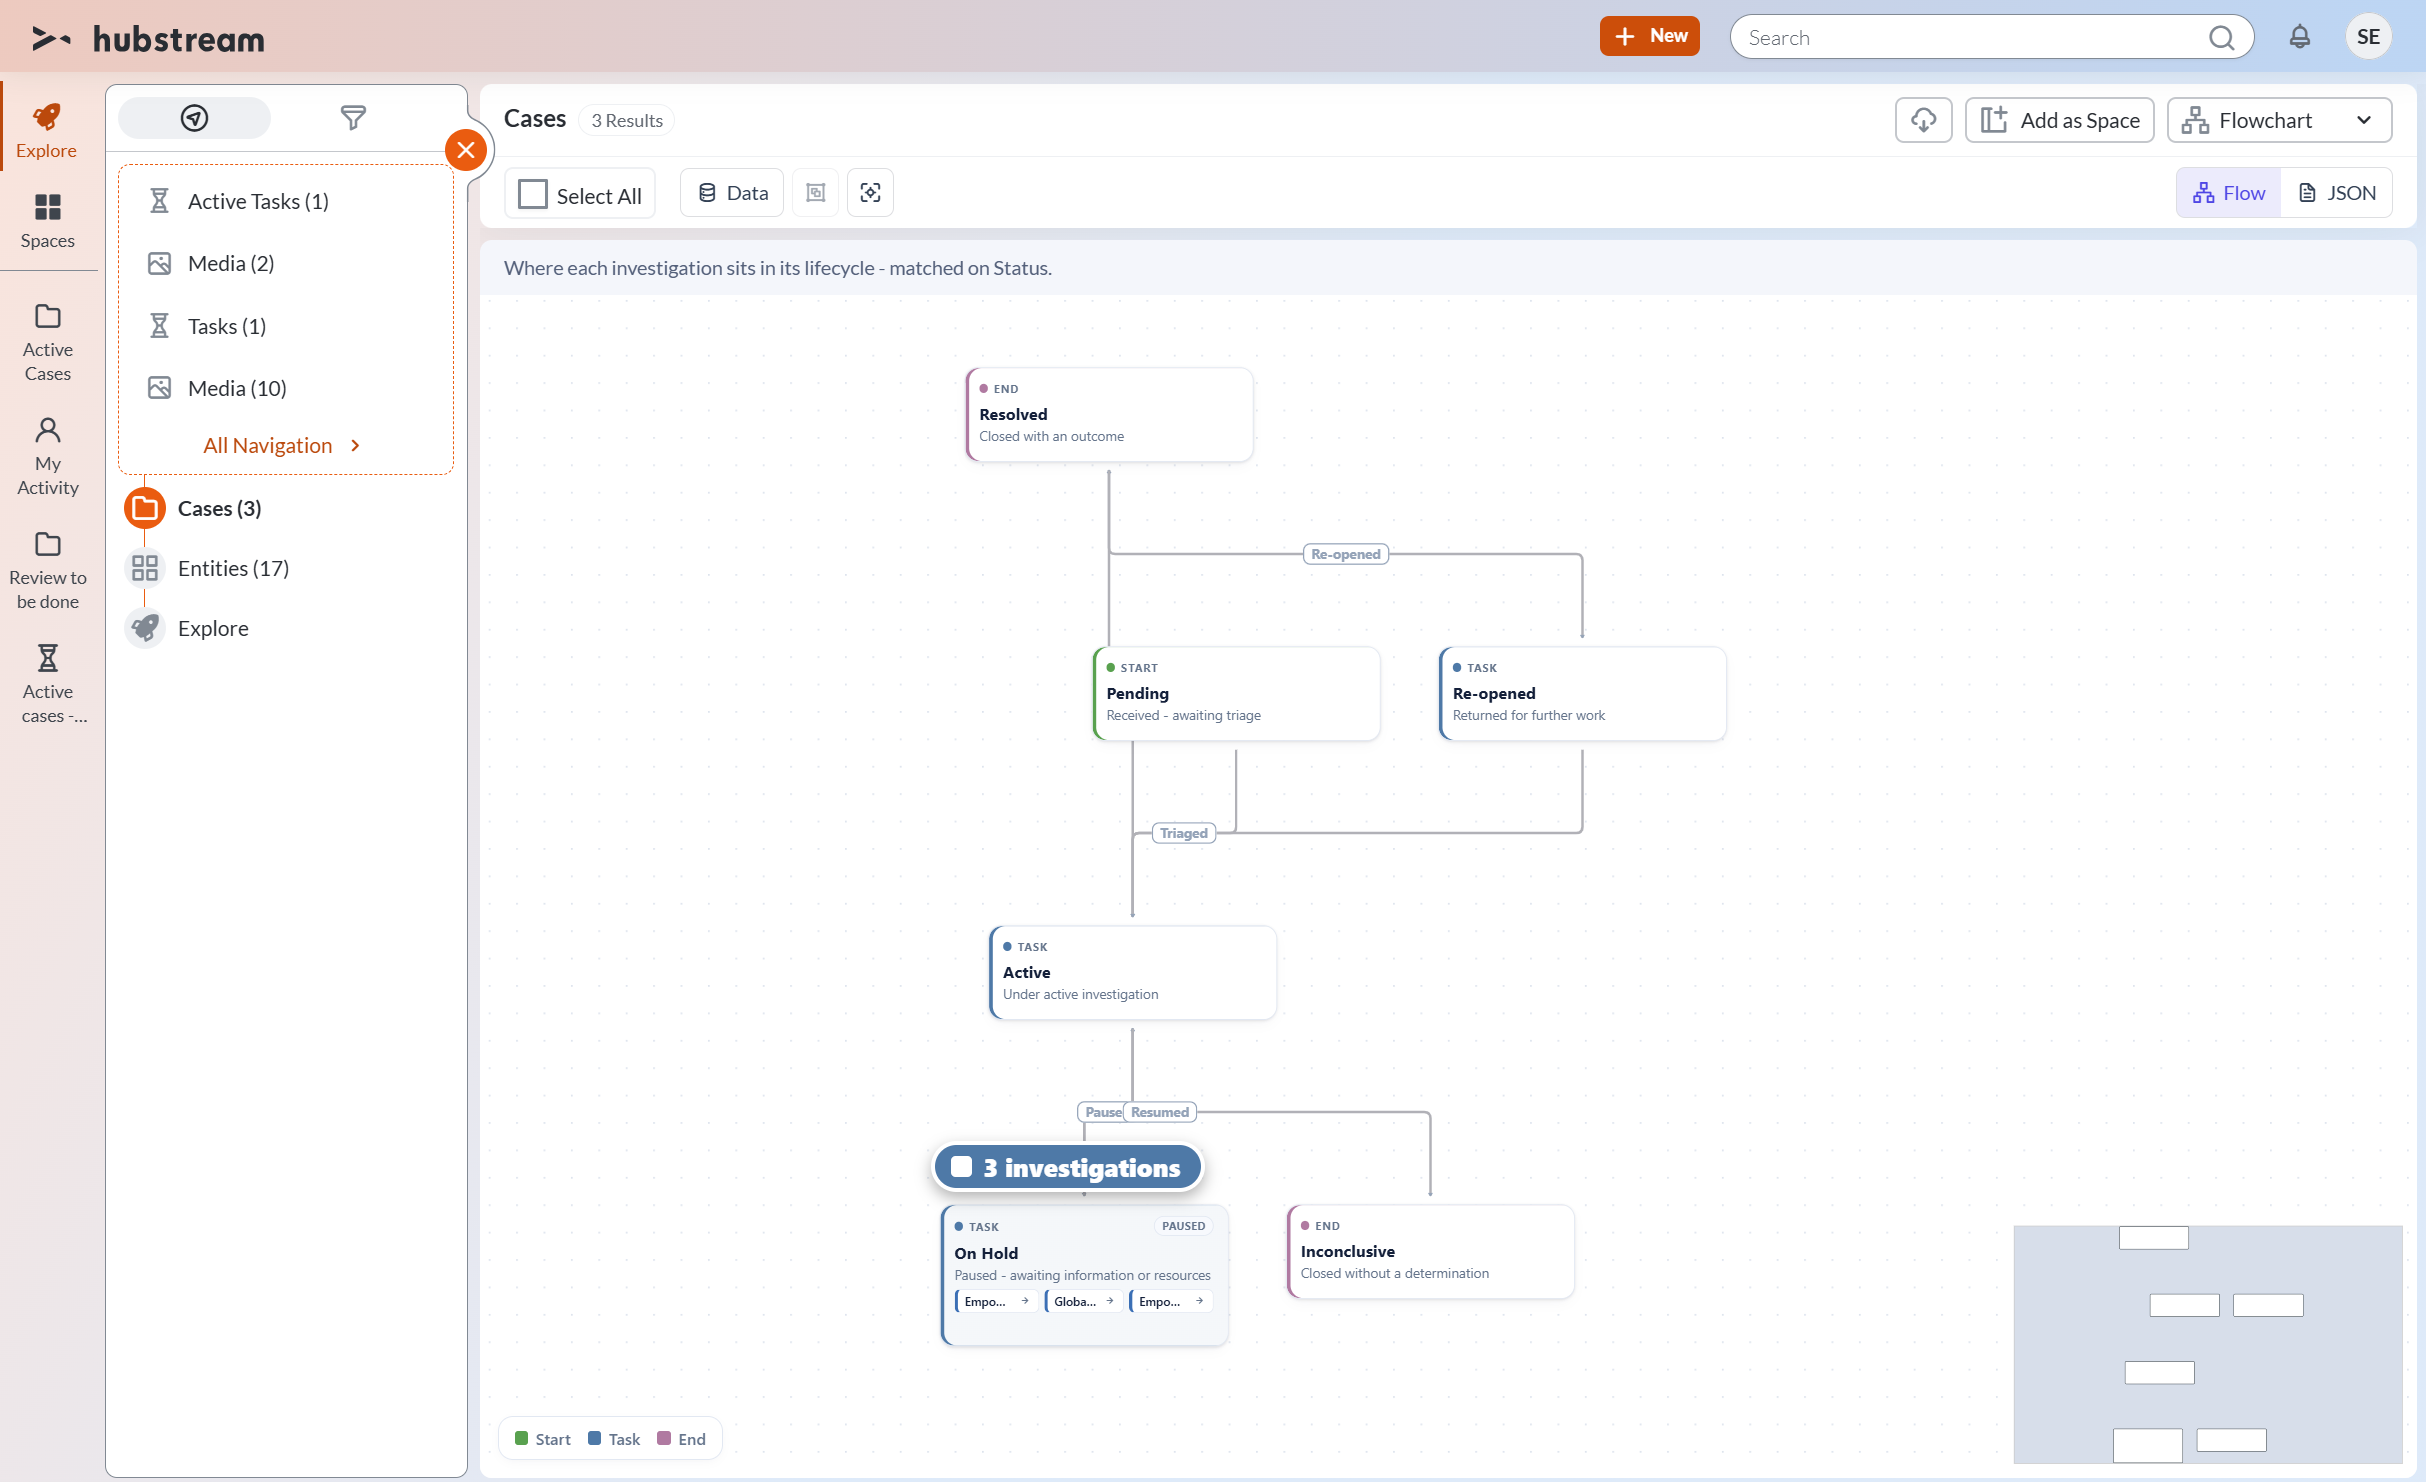
The diagram isn’t invented from the data — it’s authored, once, for the record type. The records just land on it. That’s the difference between this and a chart: the flowchart shows the stages that exist even when nothing is parked there, so an empty stage is information too.
Reading it
- Each stage is a card: its kind (Start, Task, Decision, End — the legend is bottom-left), its name, and a one-line description.
- Transitions are the arrows, labelled with what moves a record along — Triaged, Paused, Resumed, Re-opened.
- The records in your query appear as chips on the stage they match. When several records share a stage, they collapse into a count pill — click it for the list.
- On a single record, the flowchart is a you-are-here map: its stage is marked, the rest is context.
If the records carry a priority-shaped field (priority, severity, urgency, risk), the view picks it up on its own and can color chips and stages by it — nothing to configure.
Selection and navigation
Selection works the way it does everywhere else. Clicking a record chip checks it into the page selection — the usual contextual actions appear, Select All works, and Esc clears. A crowded stage’s pill carries its own checkbox that selects the whole stage at once (with the half-checked state when only some are selected).
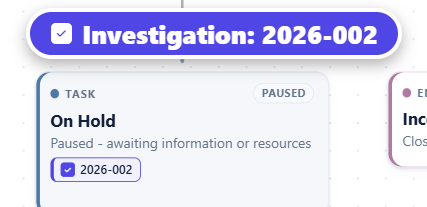
Every chip is also a link — the name with an arrow opens the record’s own page.
When the data has no workflow
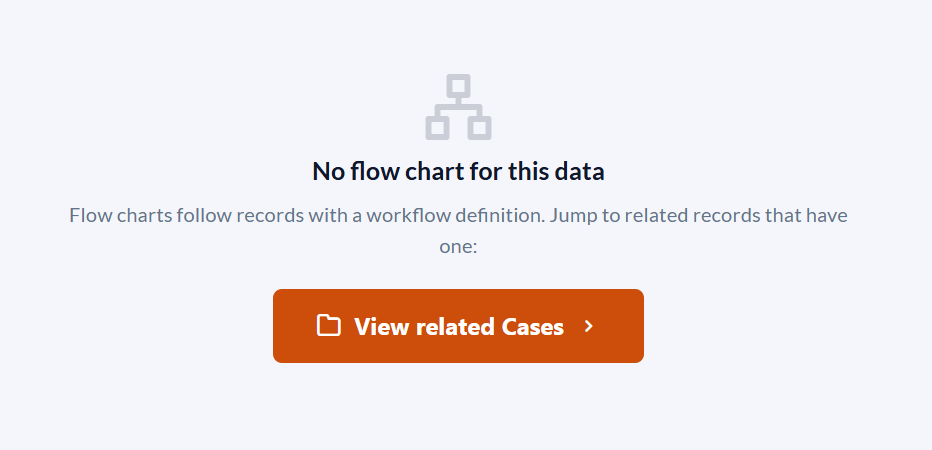
Not every record type has a workflow defined. If you land here with records that don’t, the view doesn’t show you a dead end — it offers the way to the records that do:
Defining a workflow
A workflow is defined once per record type, as an entity setting, and every flowchart of that type uses it. The definition is a small JSON document — the stages, the transitions, and the matching rule: MatchField names the column to match on, and each stage’s Value says which value of that column counts as “parked here”. Because the rule belongs to the flow, different queries sit on the same diagram with nothing to re-map.
There’s a JSON view right in the toolbar for working with the definition directly — copy it out, edit or generate a new one, and apply it back to preview against the page’s live records. The format is deliberately forgiving (stages without an ID are dropped, dangling transitions are discarded), which makes it practical to have an AI draft a workflow — “draw me an onboarding flow” produces JSON you can paste in and refine.
Admins also get direct editing on the canvas: add stages from the toolbar, drag things around, auto-arrange (several layout algorithms), choose palettes, and toggle what’s drawn.
The full format — every field, the preview loop, and how to deploy a definition — is documented in Writing Flowchart Definitions.
Before you rely on it
- One workflow per record type. The definition is an entity setting, so every flowchart of that type shows the same diagram.
- Matching is by value. A record whose
MatchFieldvalue doesn’t match any stage simply isn’t placed — check the stageValues against the values actually stored on the records. - Editing is for admins. The view ships read-only; building and rearranging workflows is an admin capability.